Project 1 outputs
The assignment for Project 1 can be found here.
Below are projects the teams produced.
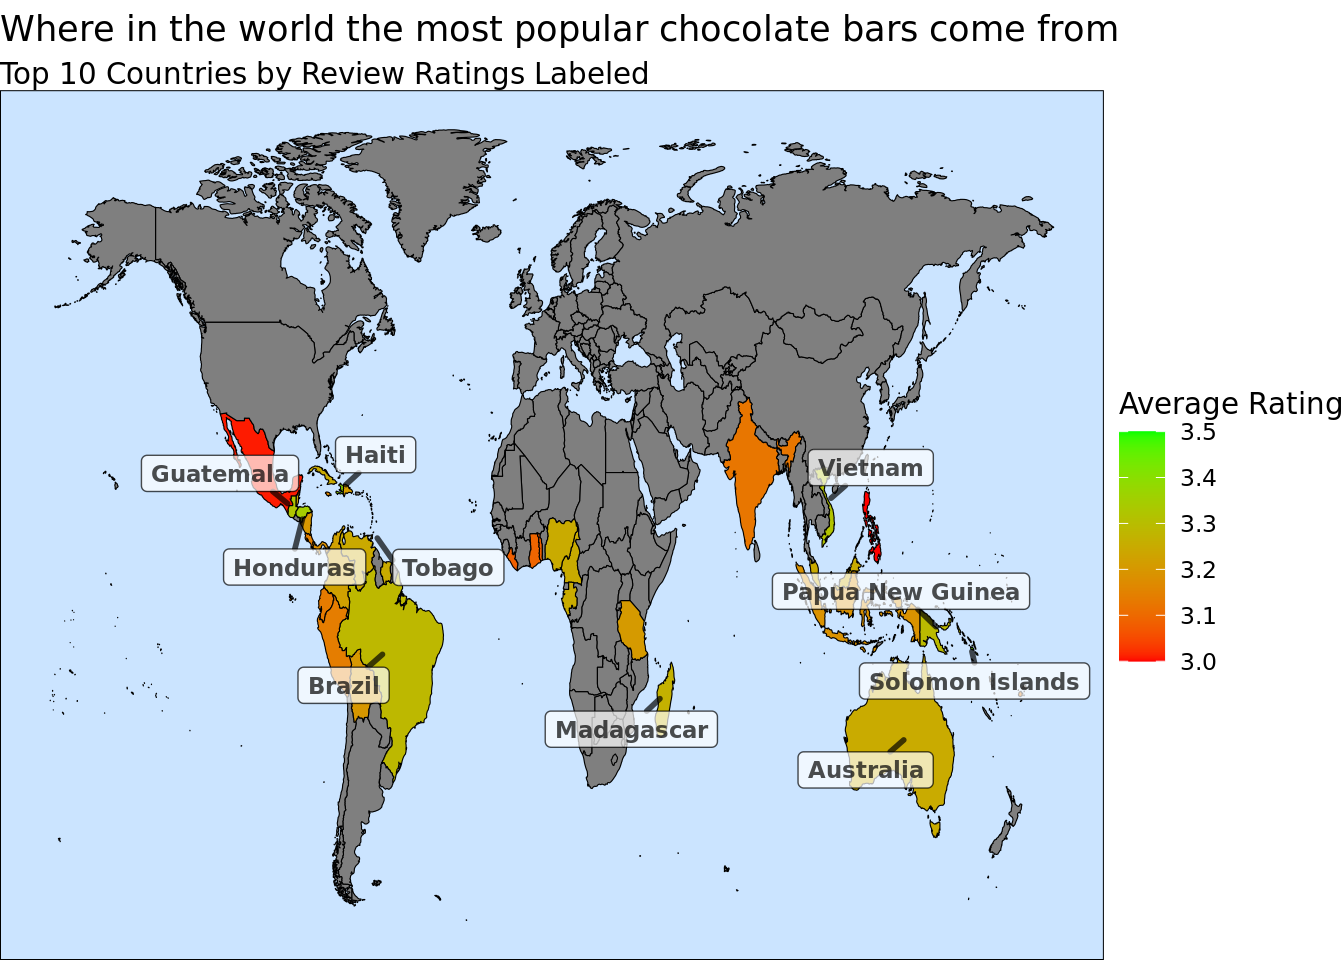
What makes a good chocolate bar? by The Blue Team
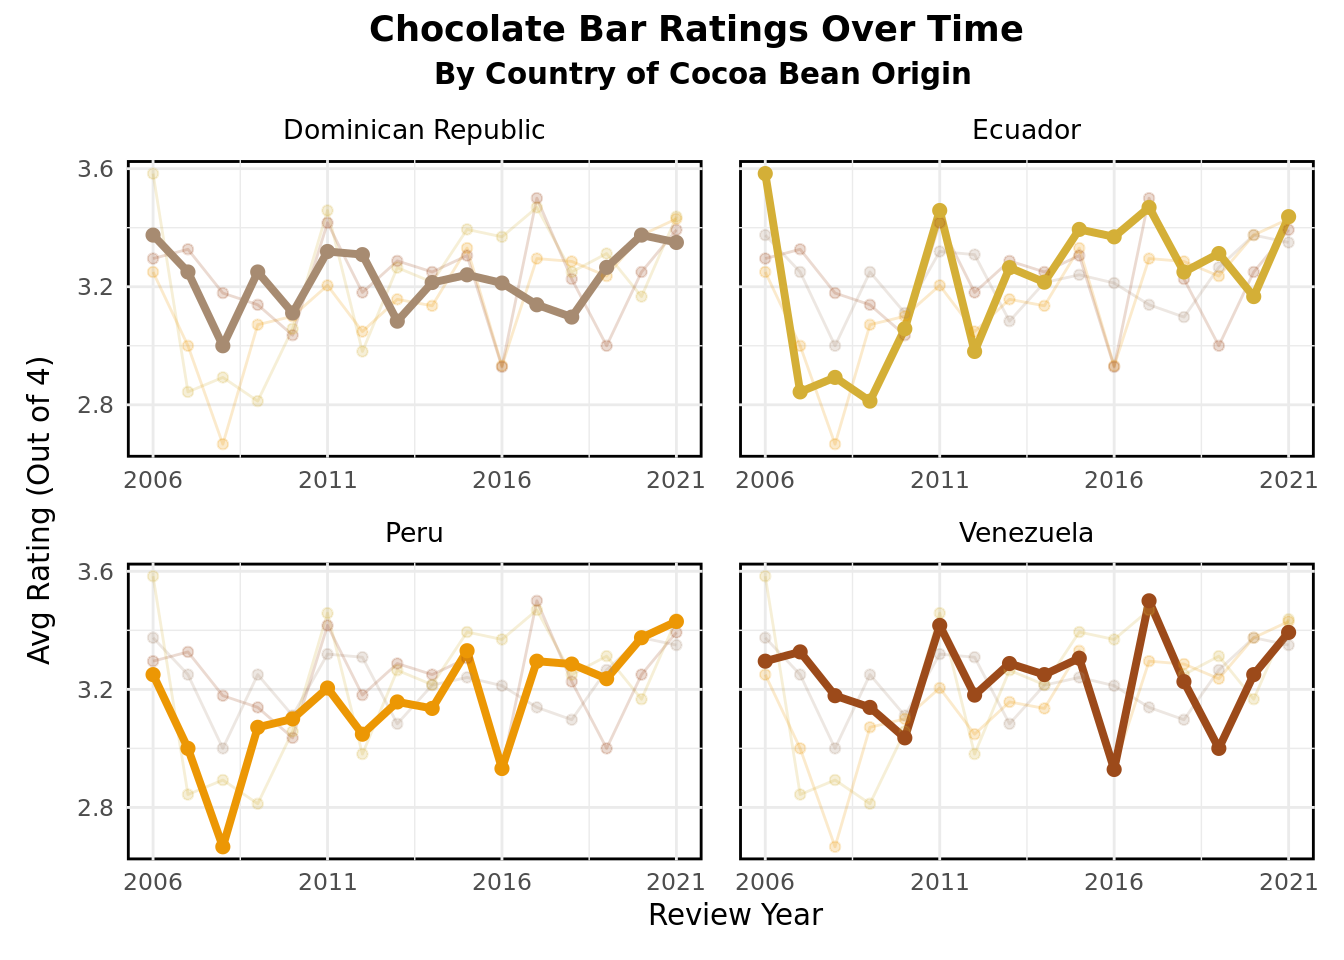
Answer two key questions: where the highest-reviewed chocolate is produced and what ingredients comprise the chocolate with highest reviews. Read more.
The Hypocrisy of US Corporate Pride and Anti-LGBTQ+ Donations by Co-Medians
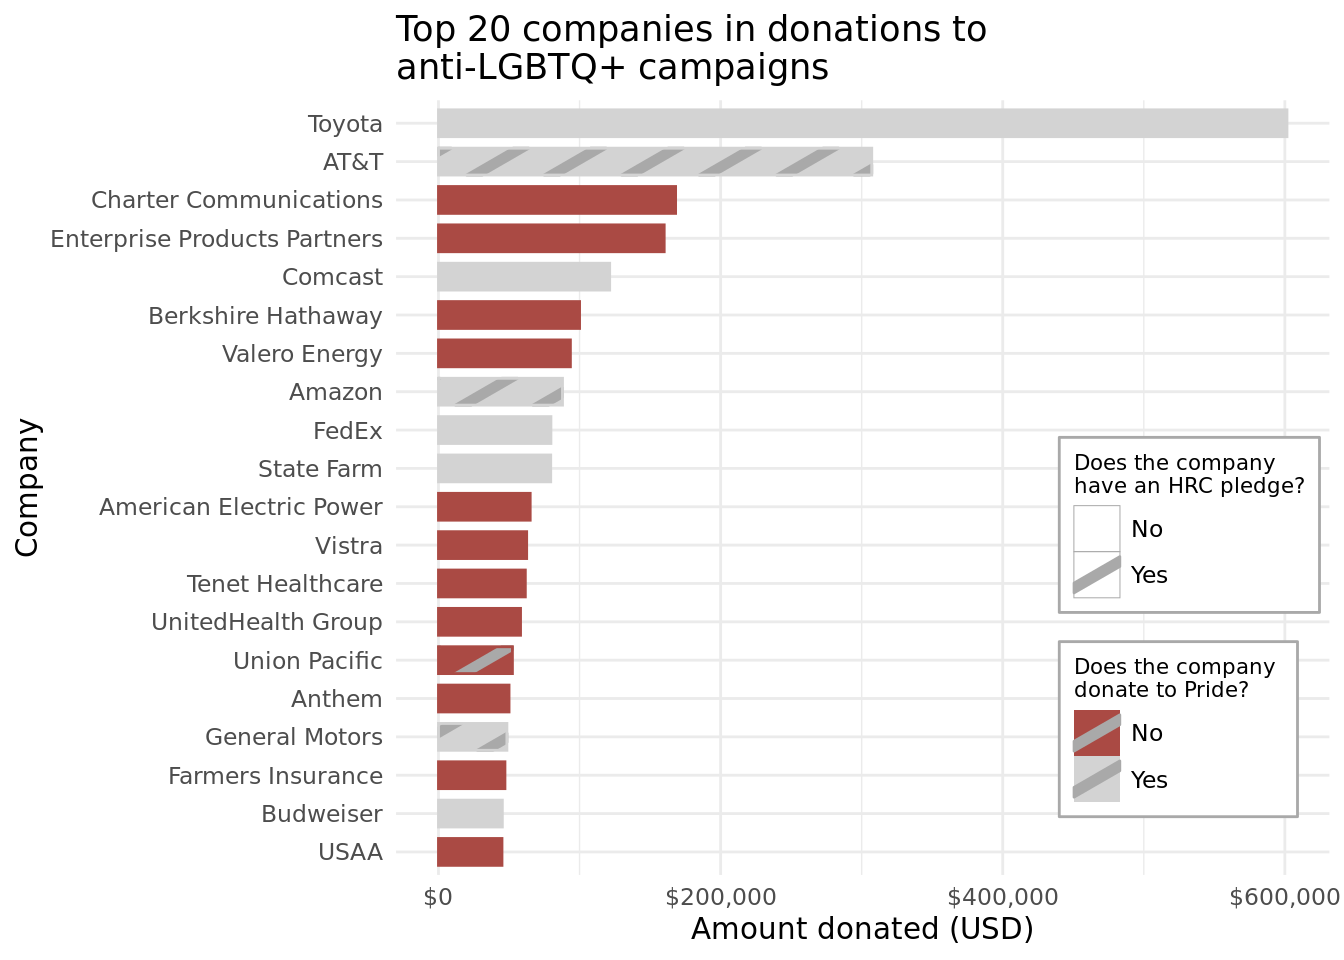
Delve into two key players in the Pride and anti-LGBTQ+ movements– companies and politicians– to understand how both stakeholders are associated with anti-LGBTQ+ campaigns that undermine progress to empower the U.S. LGBTQ+ community. Read more.
Collegiate Sports Budget Analysis by ggplot <3
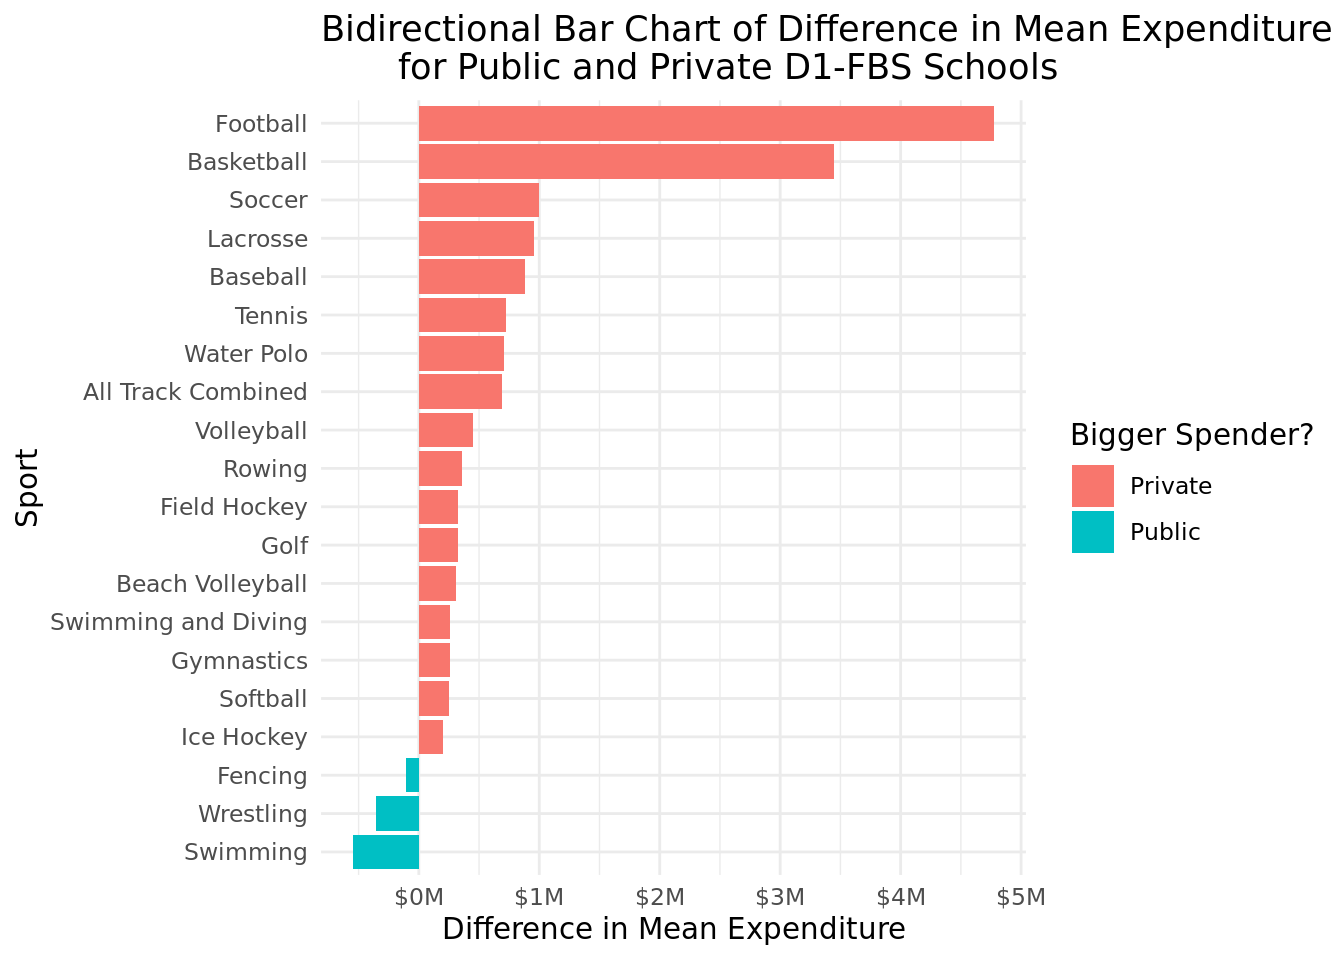
Highlight various trends and disparities in college sports funding, and provide opportunities for further investigation. Read more.
Are You Board Yet? by Marvel Cinematic Tidyverse
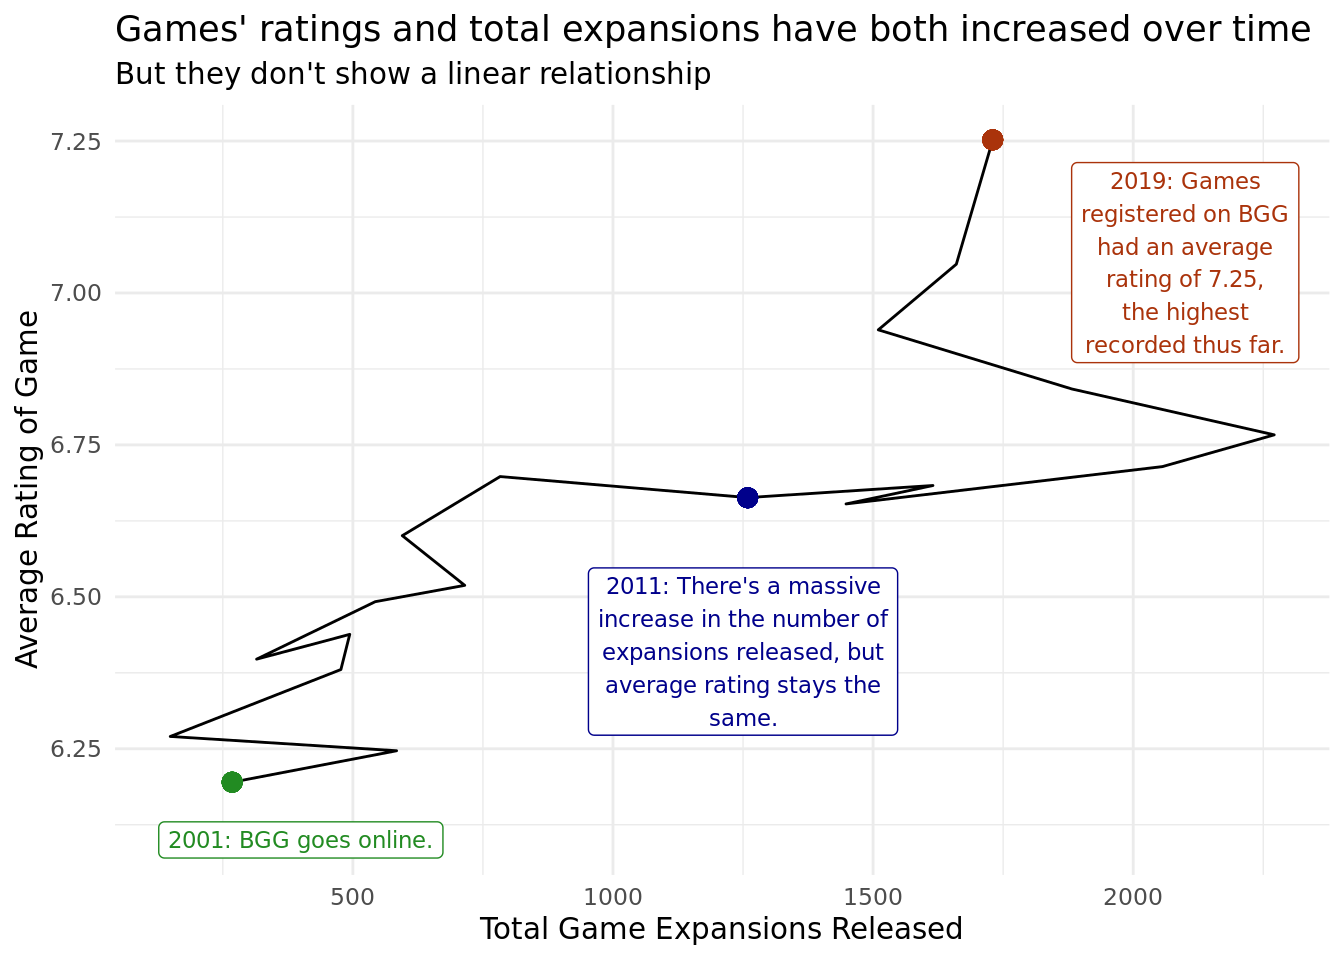
Explore if games with higher differences between the minimum number and the maximum number of players tend to be more highly rated as well as how the number of expansions for board games changed over time, and whether or not they have had an impact on game ownership. Read more.
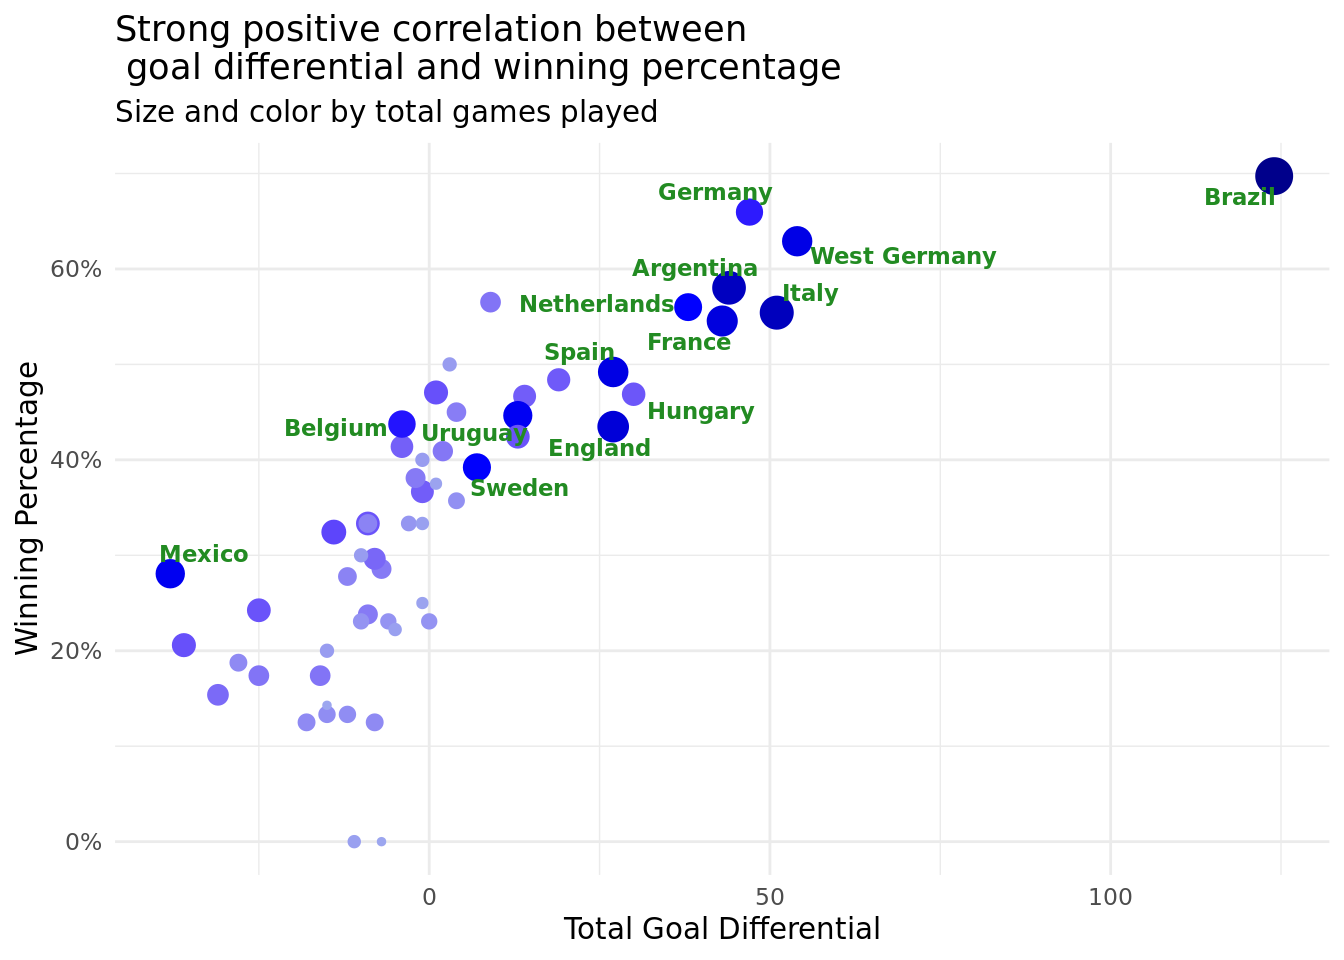
The Evolution of the World Cup by Team Messi
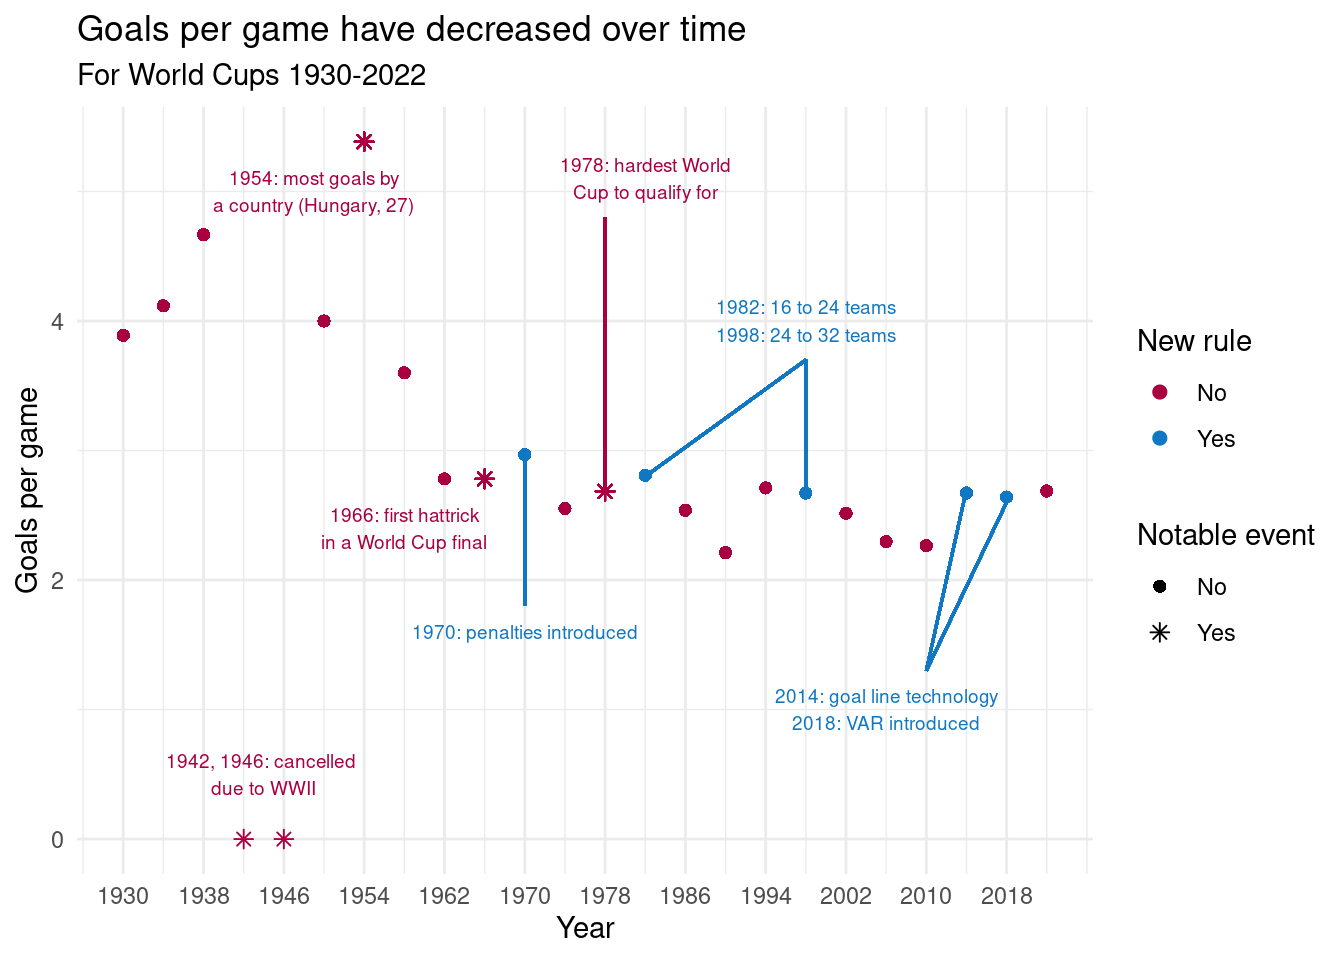
Explore goal scoring trends and representation of teams from non-European countries in the FIFA World Cup. Read more.
A Student’s Review of Expert Reviews of Chocolate Bars by The O_GGS
Explore what characteristics (as identified by experts) of chocolate bars lead to the most successful chocolate bars and how expert opinions of these characteristics have changed over time. Read more.
Visualizing Factors Leading to Success in Eurovision Competitions by PHANs of Statistics
Visualize and understand what factors lead to success in the competition, while also studying voter bias and inconsistency within the voter ranks. Read more.
Visualizing the relationship between dog traits and breed popularity by Pipe it Up
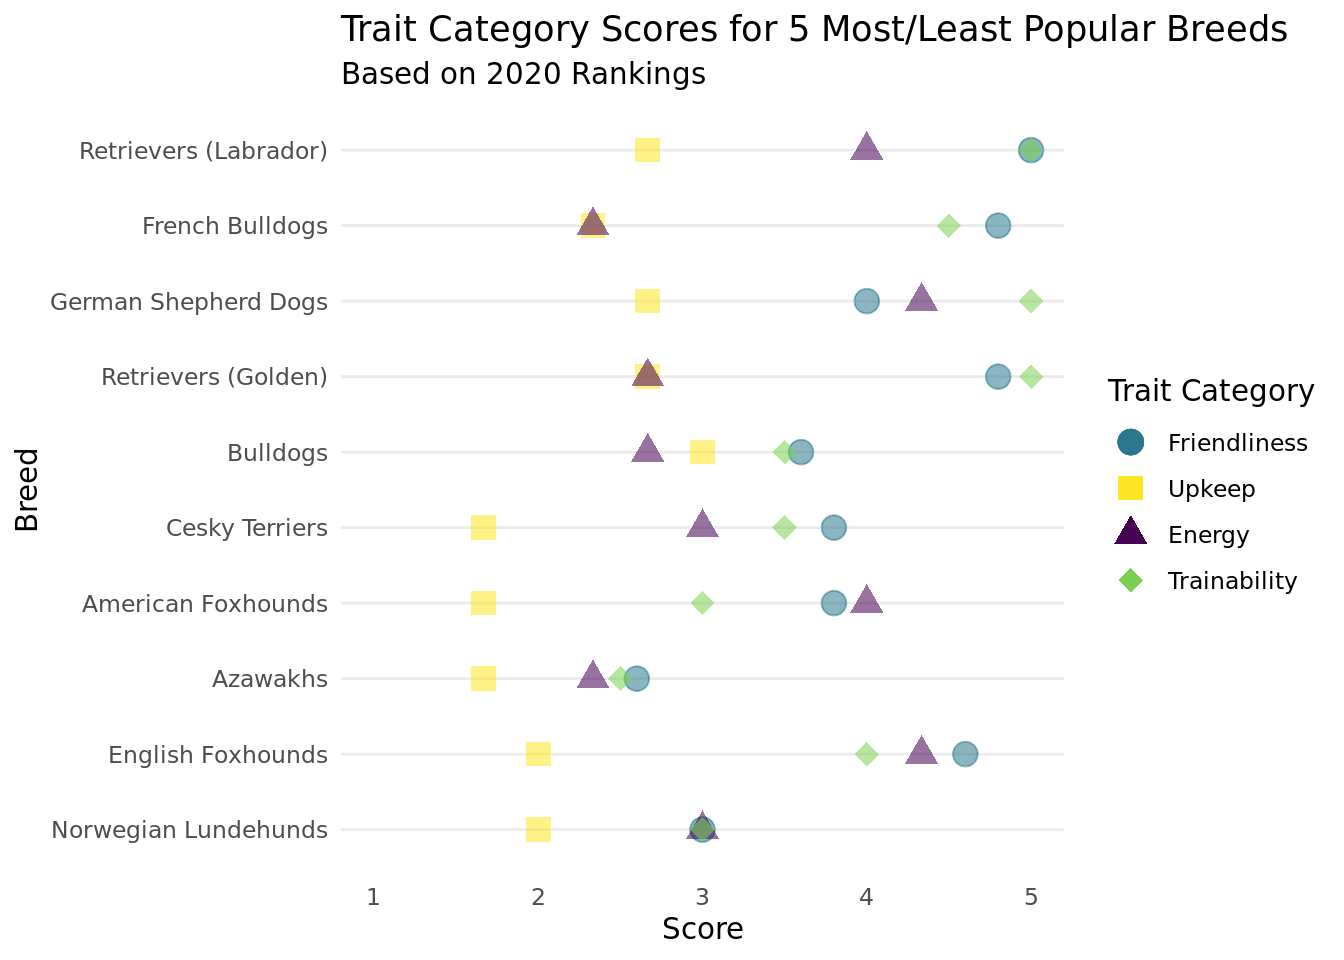
Create four visualizations pertaining to the popularity of American Kennel Club-registered purebred dog breeds. Read more.
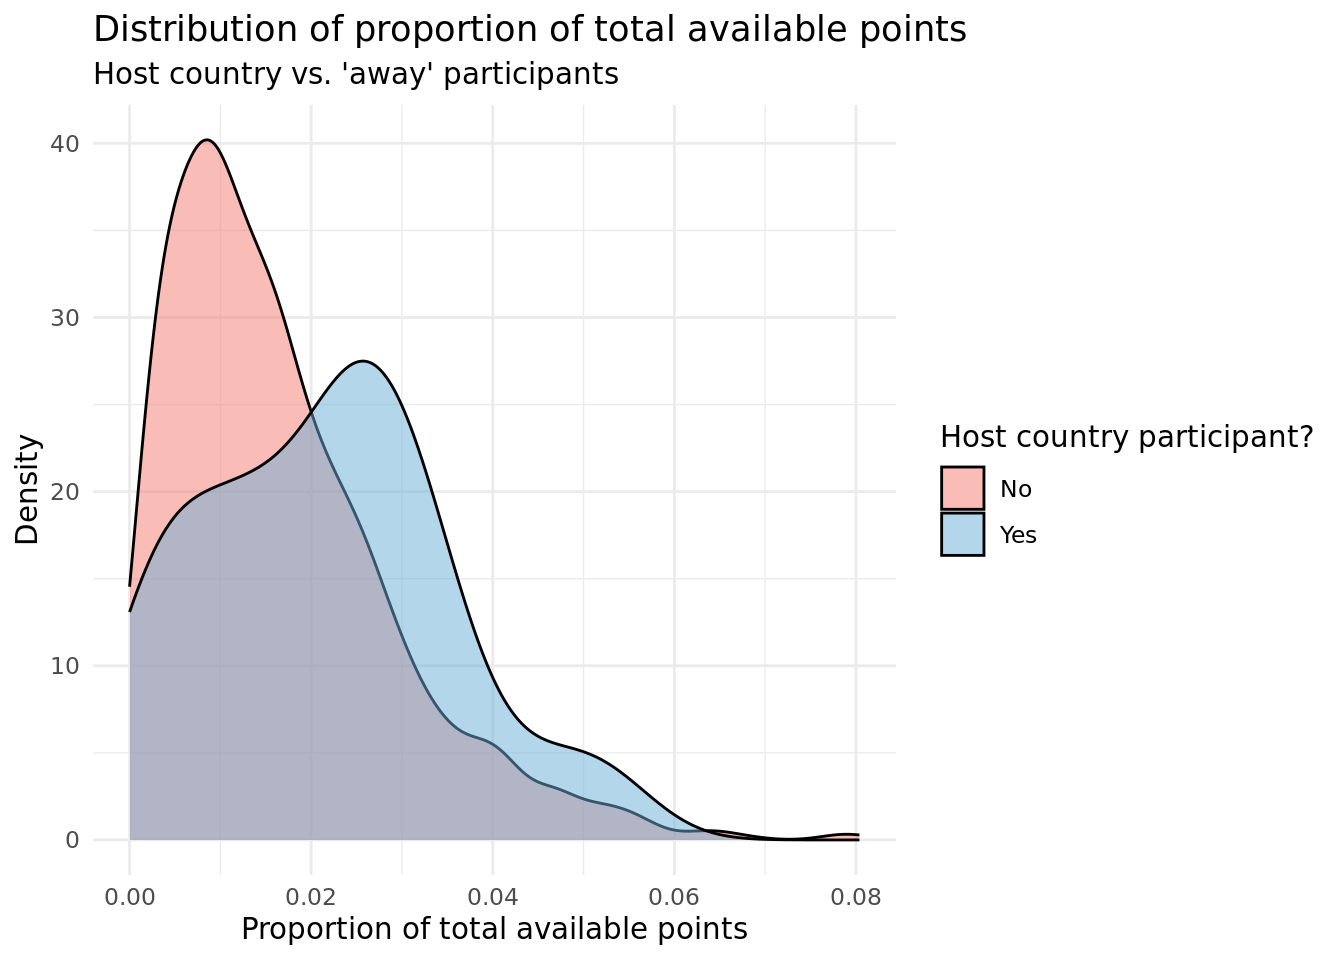
World Cup Scoring Trends by RGodz
Explore goals per match by tournament stage over time and country Success over time. Read more.
The Great British Visualization by SKAZ
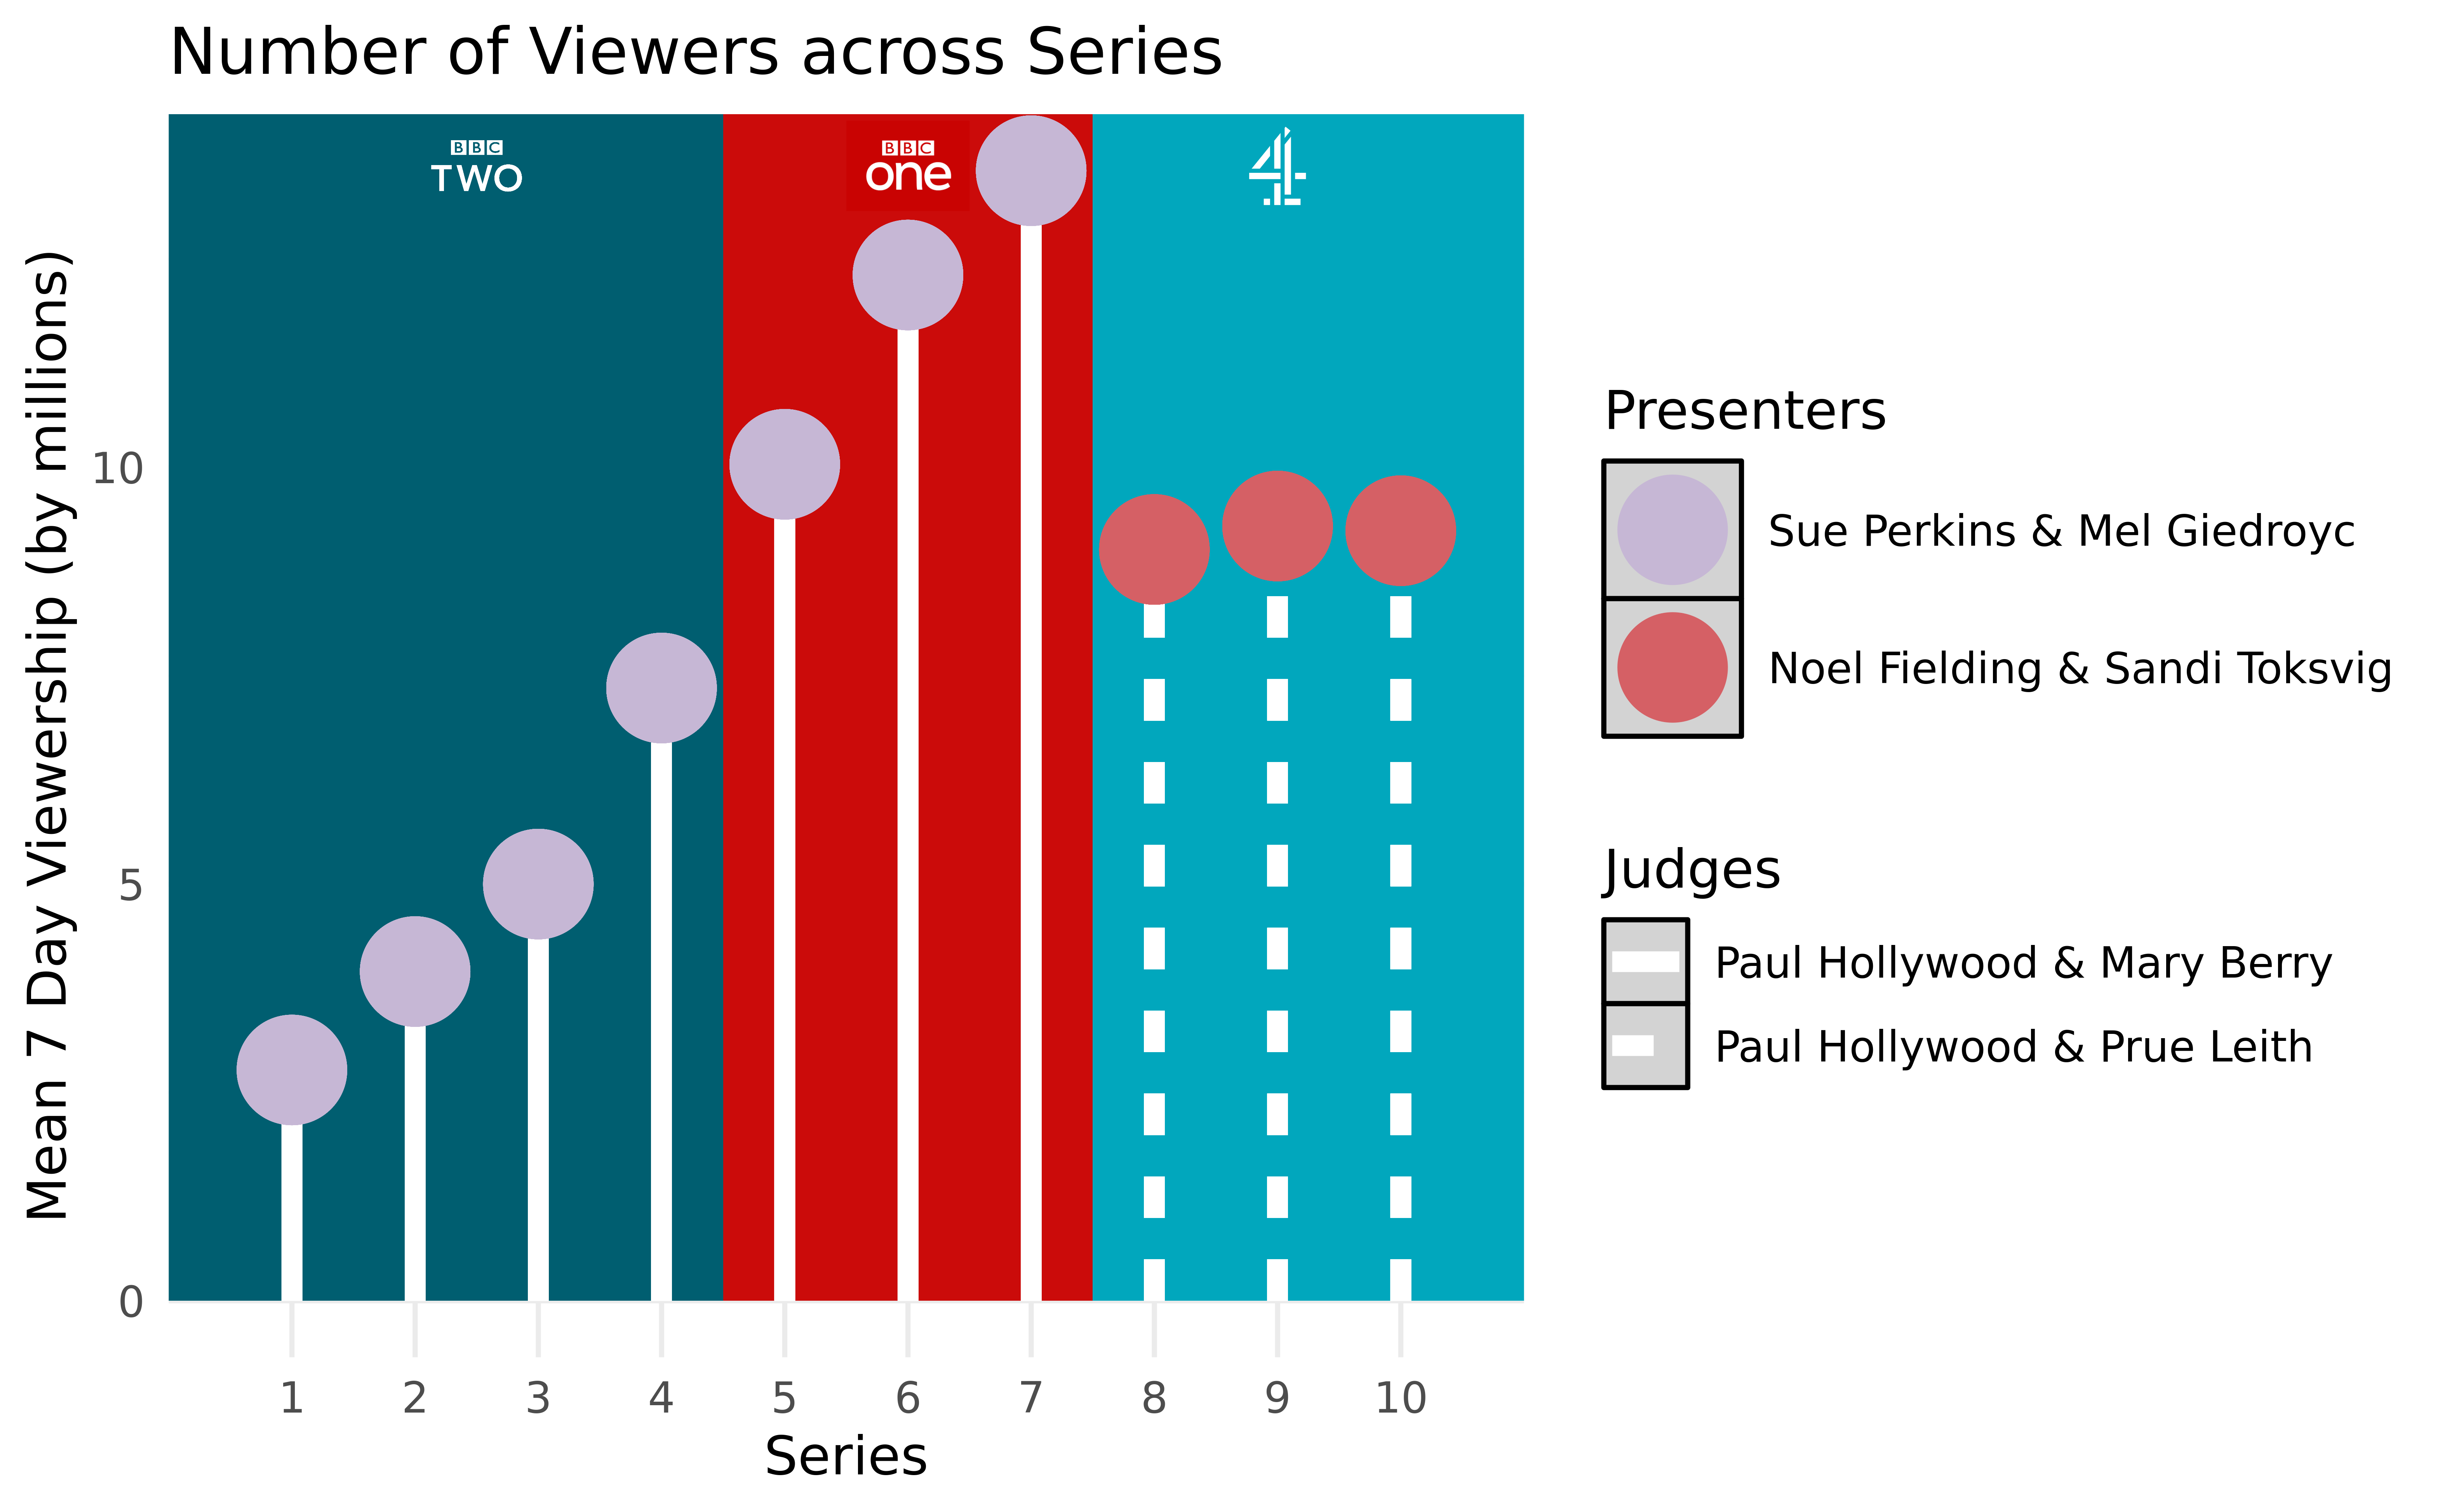
Analyze how changes in the show’s network and presenters/judges correlate to the show’s popularity as well as how viewership varies between different points in each season (which episode numbers consistently get more viewership than others). Read more.
Exploring the Distribution of Radio Stations Across the U.S. by Stats FM
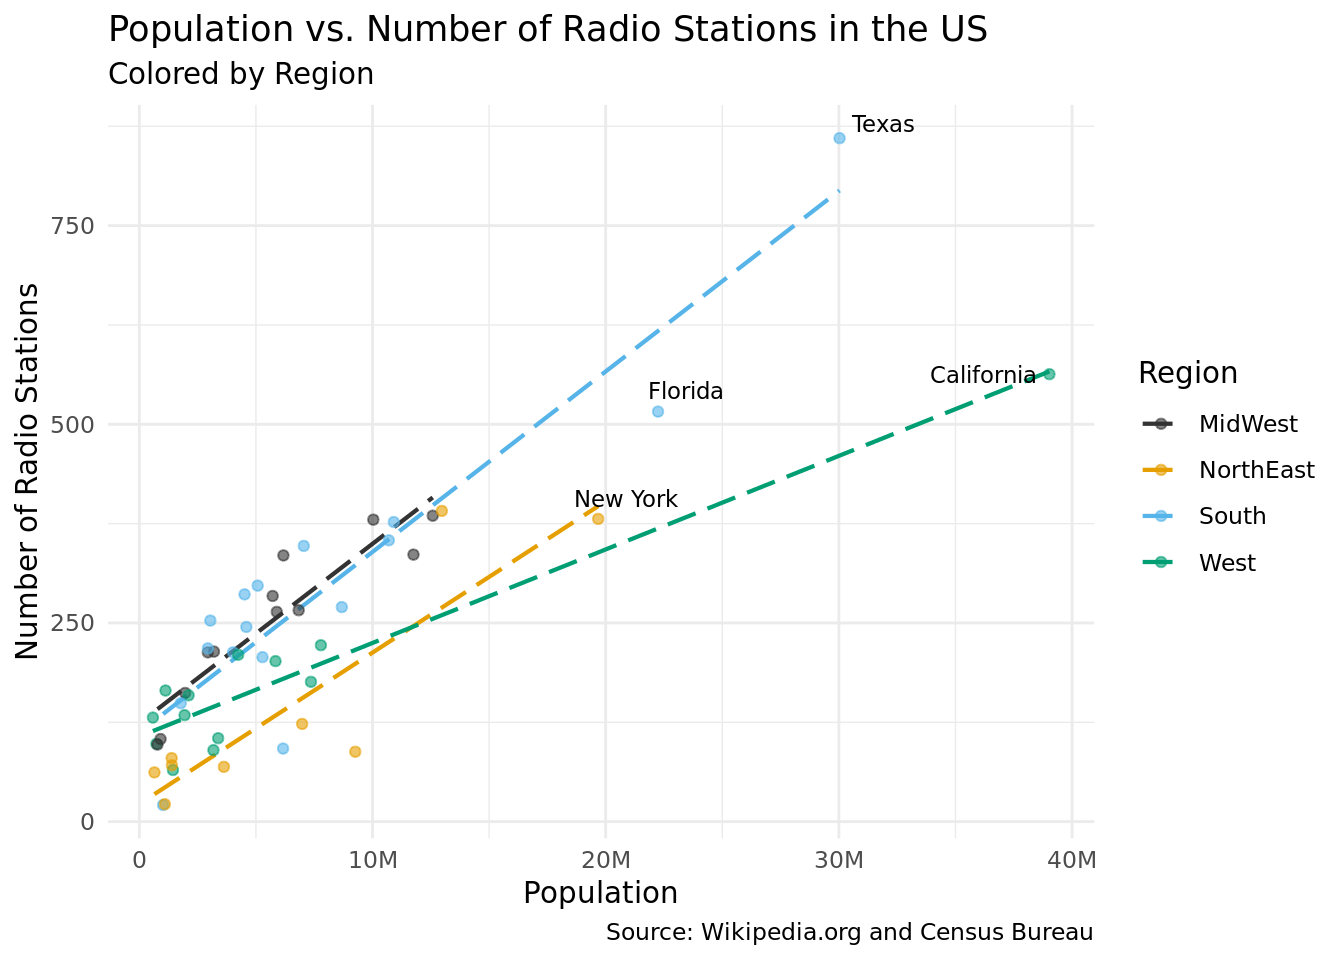
Explore if there are regional trends in the genre of radio stations in each state and also studies the relationship between population density and the number of radio stations in each state. Read more.
Investigating America’s Most Reputable Companies by Team Six
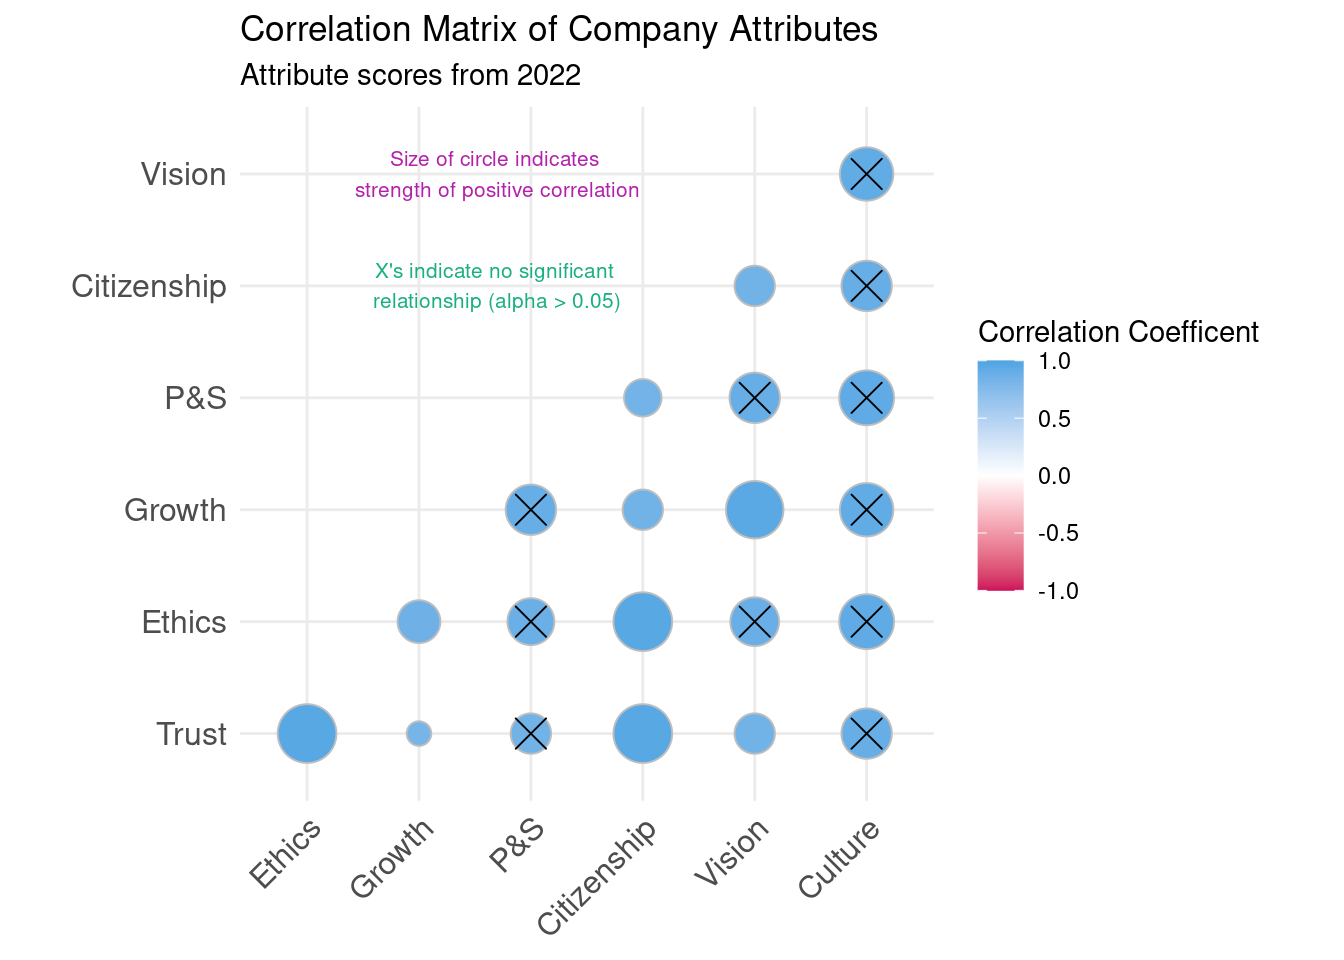
Investigate the different factors that contribute to customer perceptions of notable company reputations. Read more.
Statsquatch: A Data Expedition into Bigfoot Sightings by The Tibbles
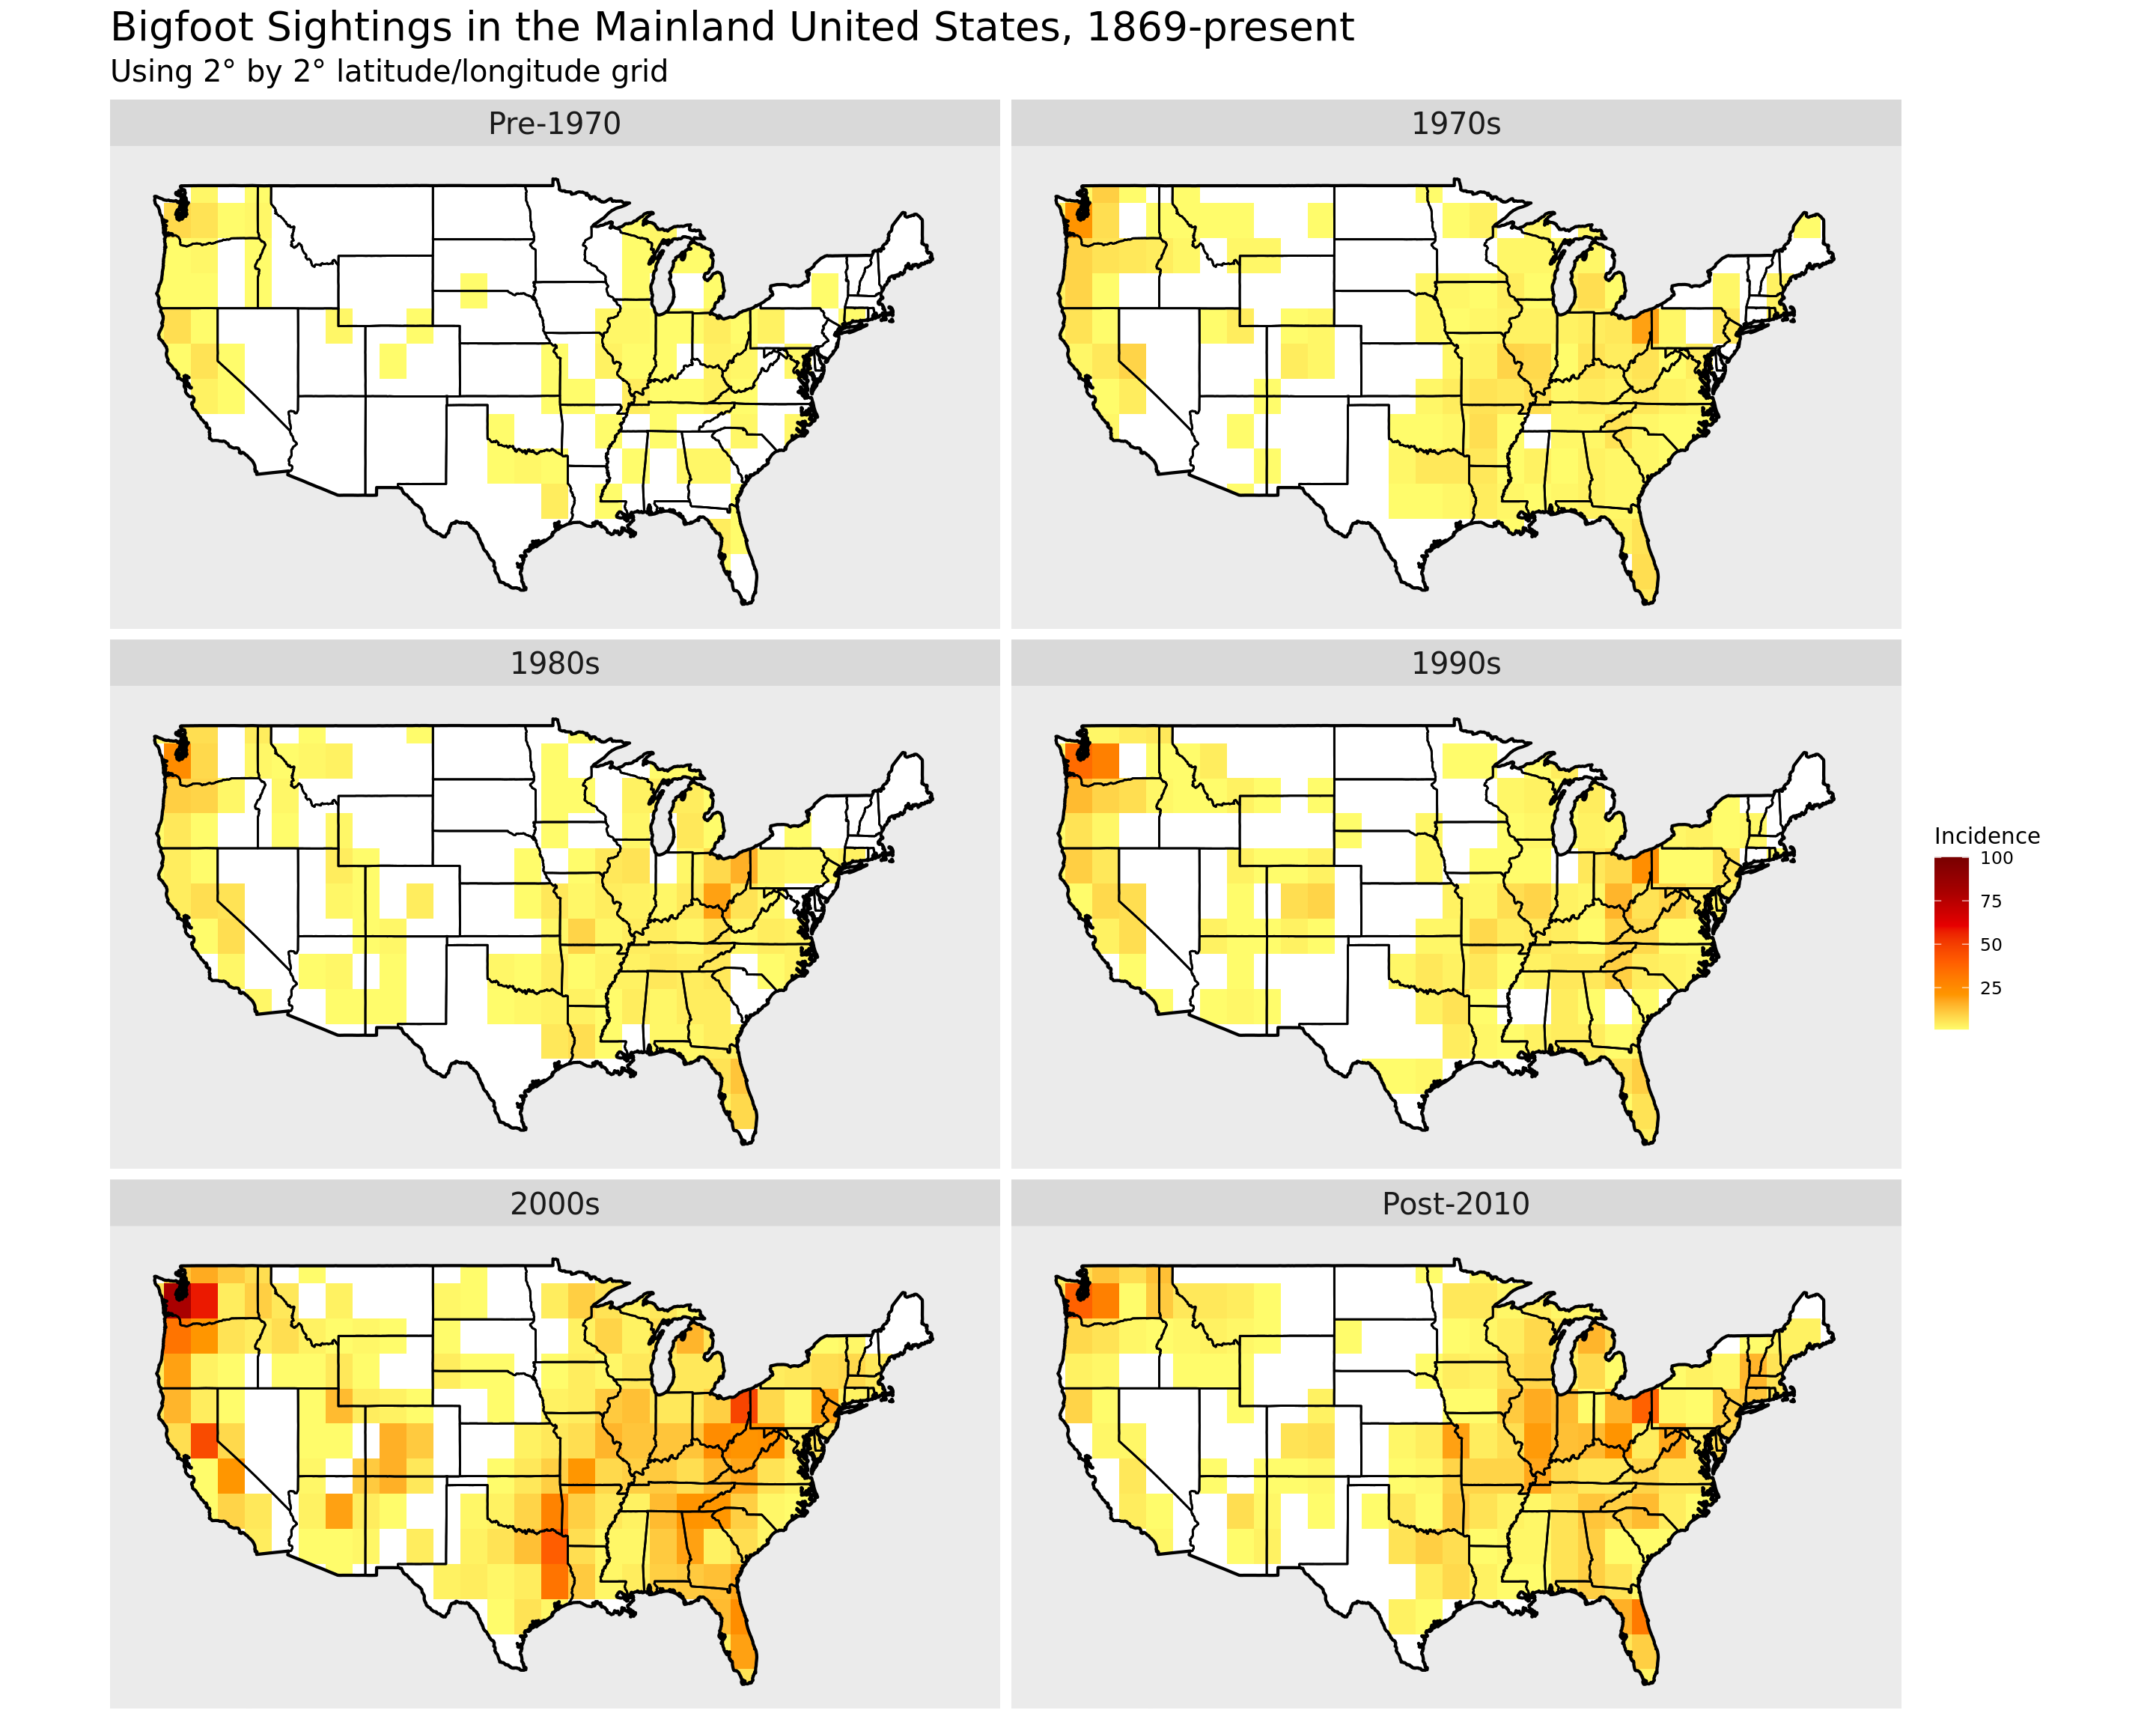
Analyze and highlights trends in some of the geographic and weather conditions most commonly associated with Bigfoot sightings. Read more.
Financing College: Exploring Pell Grant Awards by Visualization Warriors
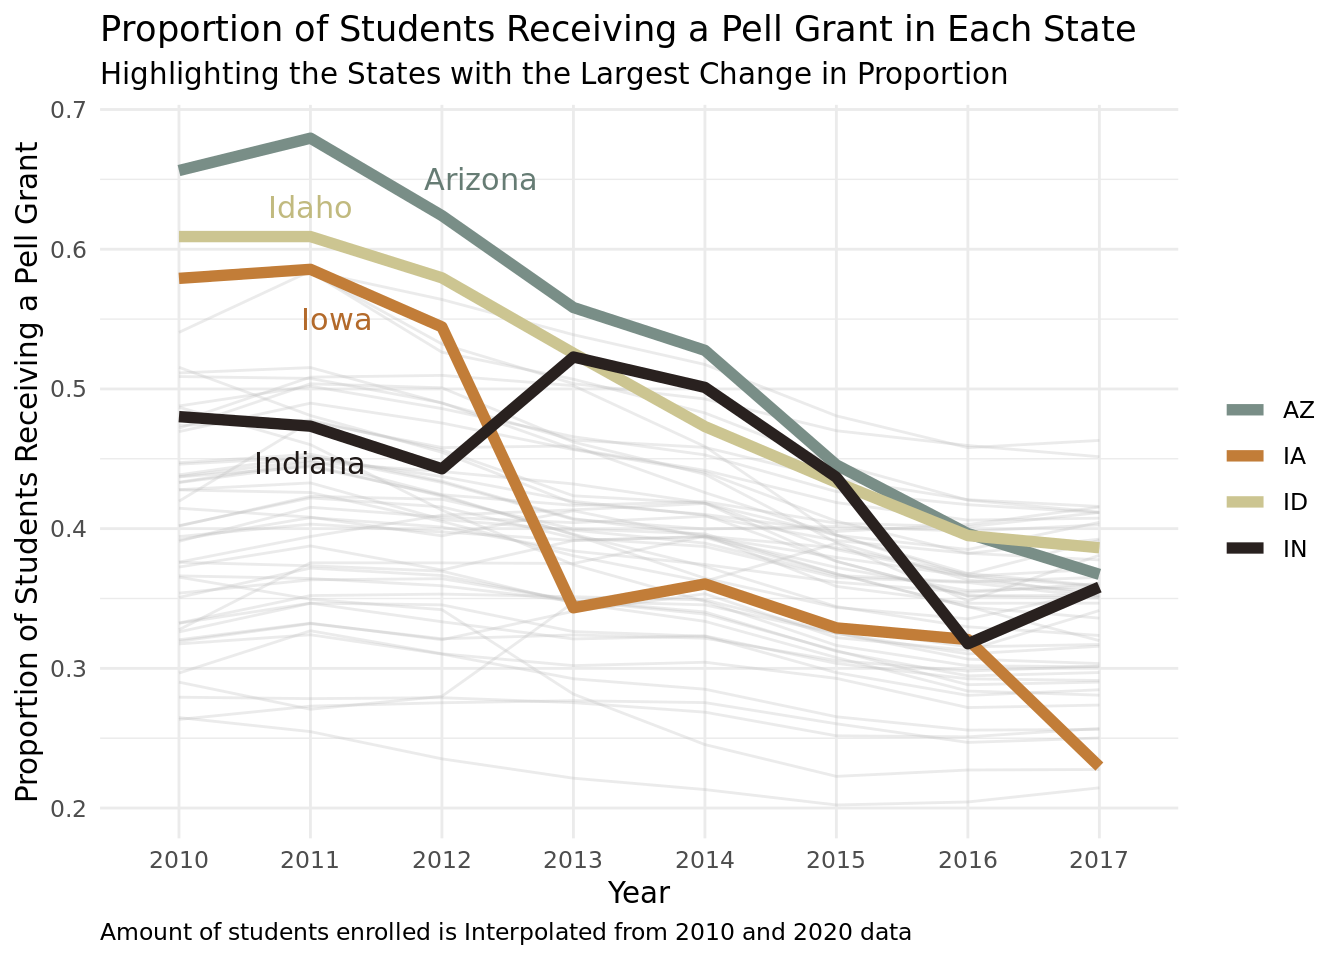
Explore how the average Pell grant award has changed over time across regions and which states have seen the greatest change in the percentage of awarded Pell grants to total students enrolled in university over time. Read more.