# load packages
library(countdown)
library(tidyverse)

# set theme for ggplot2
ggplot2::theme_set(ggplot2::theme_minimal(base_size = 14))

# set width of code output
options(width = 65)

# set figure parameters for knitr
knitr::opts_chunk$set(
  fig.width = 7,        # 7" width
  fig.asp = 0.618,      # the golden ratio
  fig.retina = 3,       # dpi multiplier for displaying HTML output on retina
  fig.align = "center", # center align figures
  dpi = 300             # higher dpi, sharper image
)Visualizing Likert data III
Lecture 17
Dr. Mine Çetinkaya-Rundel
Duke University
STA 313 - Spring 2023
Warm up
Announcements
- HW 4 due Thursday
- Project 2 proposals for peer review due next Tuesday – start working on them in lab tomorrow at the latest
Setup
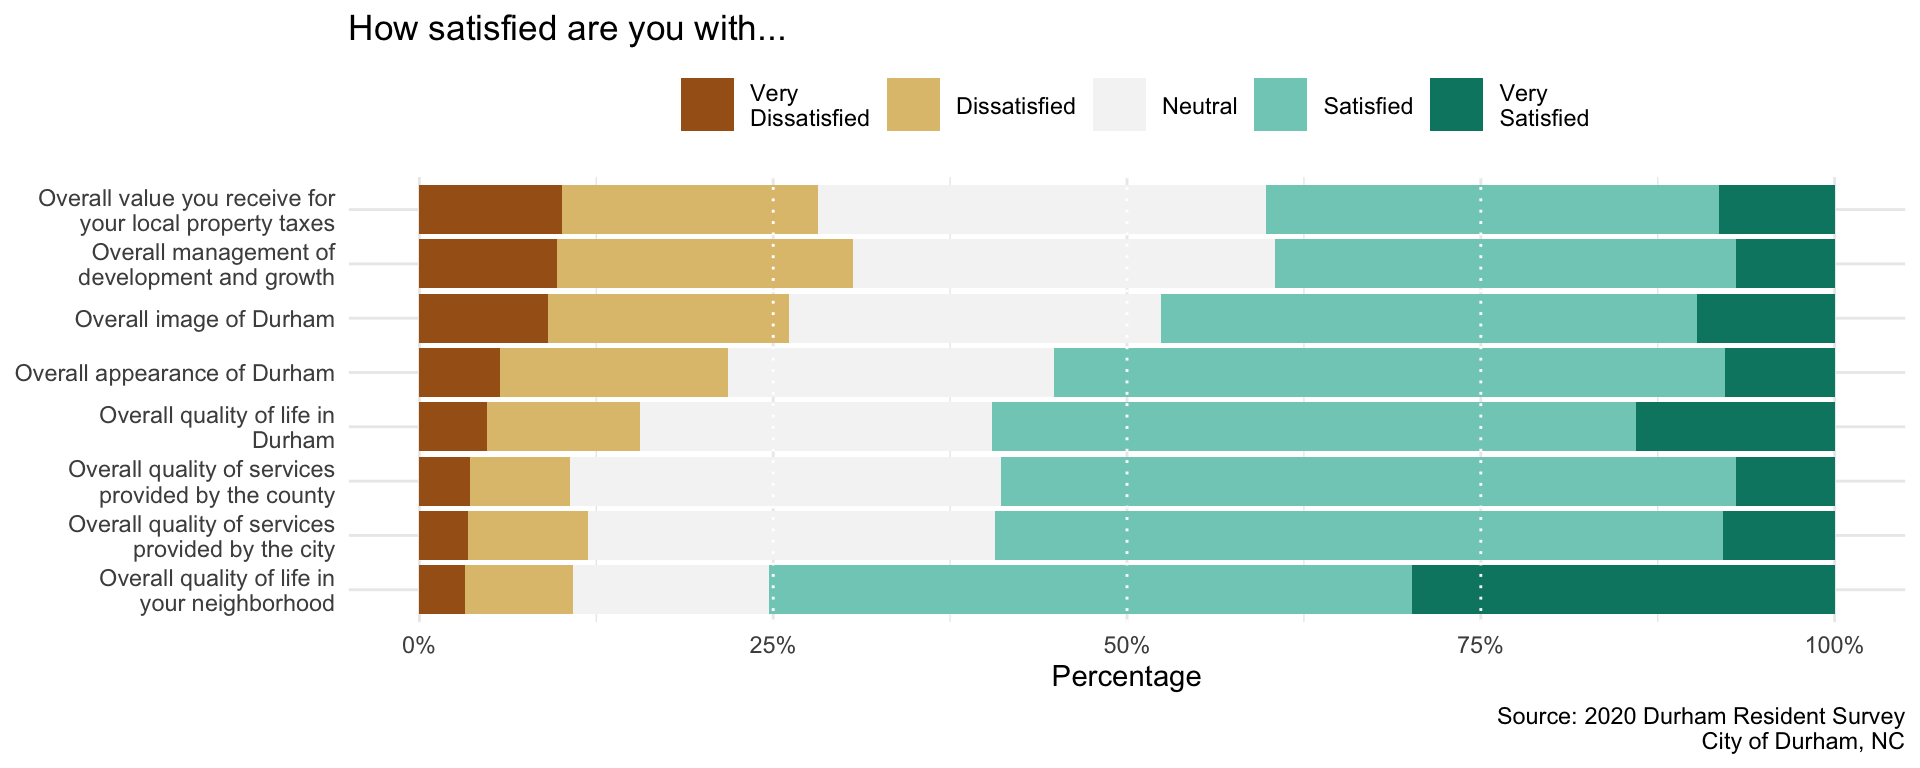
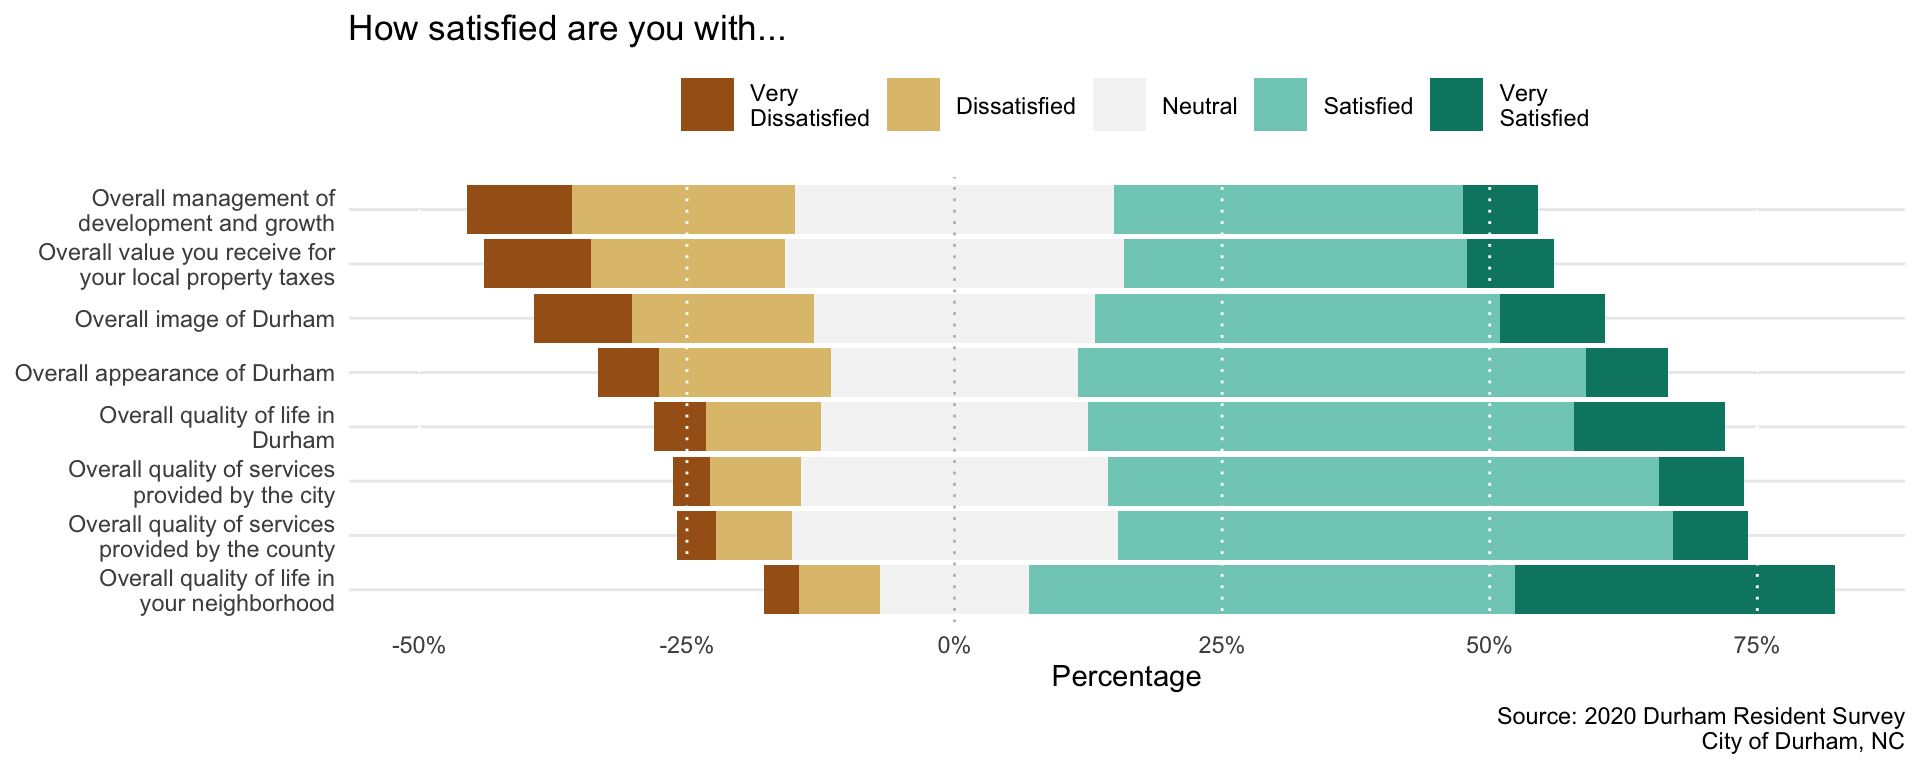
Likert data visualizations
Considerations
Diverging charts
100% charts
NAs vs. neutrals/neithers
What have you learned from the reading about these considerations?
Let’s make some!
Go to ae-15.