# load packages
library(countdown)
library(tidyverse)
library(colorspace)
library(cowplot)

# set theme for ggplot2
ggplot2::theme_set(ggplot2::theme_minimal(base_size = 14))

# set width of code output
options(width = 65)

# set figure parameters for knitr
knitr::opts_chunk$set(
  fig.width = 7,        # 7" width
  fig.asp = 0.618,      # the golden ratio
  fig.retina = 3,       # dpi multiplier for displaying HTML output on retina
  fig.align = "center", # center align figures
  dpi = 300             # higher dpi, sharper image
)Project 2 preview +
Visualizing Likert data I
Lecture 15
Dr. Mine Çetinkaya-Rundel
Duke University
STA 313 - Spring 2023
Warm up
Announcements
- HW 3 is due Thursday
- Question 2: Include old figure from project as starting point
- All questions: Add alt text with
fig-alt
- Make sure to reply to “Sharing your project” issues on Project 1 if you haven’t already
Setup
Quiz review
Let’s imagine we’re playing a game
The odds are in your favor:
You have a 90% chance of winning!
playing…
Sorry, you lost. 😞
How does that make you feel?
We are bad at judging uncertainty
- You had a 10% chance of losing
- One in ten playing this game will lose
- 90% chance of winning is nowhere near a certain win
It helps to visualize a set of possible outcomes
Possible outcomes from 100 individual games played
Frequency framing
This type of visualization is called frequency framing
Project 2
Project 2 - potential directions
Present and visualize a technical topic in statistics or mathematics, e.g., Gradient descent, quadrature, autoregressive (AR) models, etc.
Build a Shiny app that that has an Instagram-like user interface for applying filters, except not filters but themes for ggplots.
Create an R package that provides functionality for a set of ggplot2 themes and/or color palettes.
Build a generative art system.
Do a deep dive into accessibility for data visualization and build a lesson plan for creating accessible visualizations with ggplot2, R Markdown, and generally within the R ecosystem.
Create an interactive and/or animated spatio-temporal visualization on a topic of interest to you, e.g., redistricting, COVID-19, voter suppression, etc.
Recreate art pieces with ggplot2.
Make a data visualization telling a story and convert it to an illustration, presenting both the computational and artistic piece side by side.
Build a dashboard.
Or… Visualize a (non-TidyTuesday) dataset, answering a research question of interest to you.
Project 2 - all the details
Tip
Brainstorm a bunch of ideas and discard them until you settle on a topic that everyone in the team is happy with and feels like a good choice for showcasing what you’ve learned in the class and how you can use that to learn something new and implement for your project.
Project 2 - inspiration
Evan - Abstractify
Mine - Saatli Maarif Takvimi
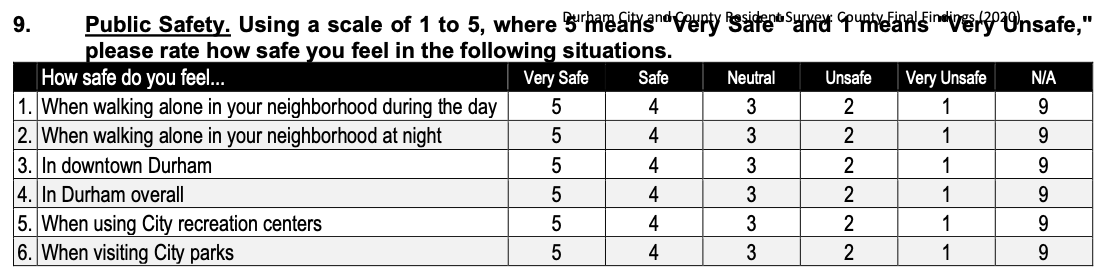
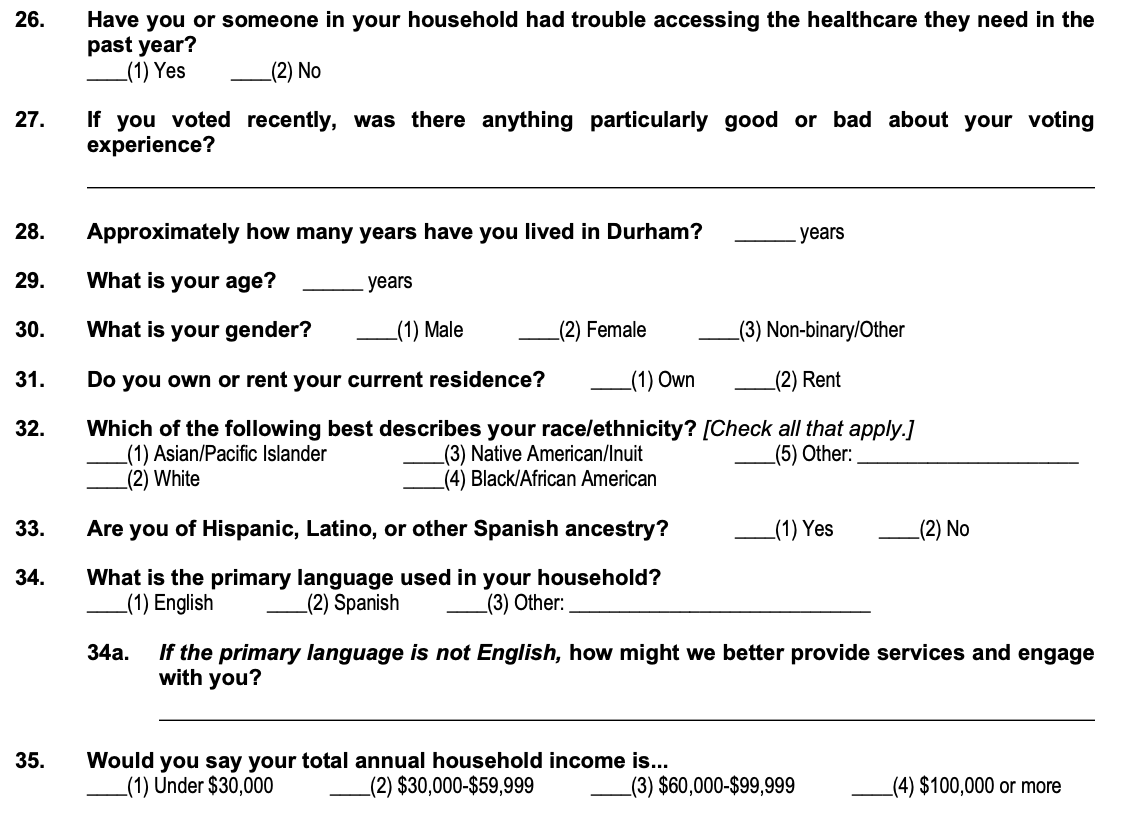
Visualizing Likert data
2020 Durham City and County Resident Survey
Sample survey questions I
Sample survey questions II
Sample survey questions III
ae-13
Let’s go to ae-13 and dive in!